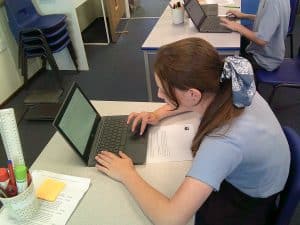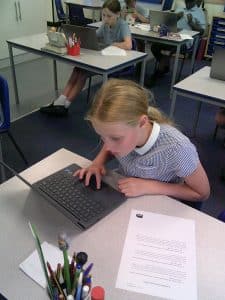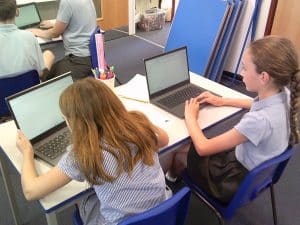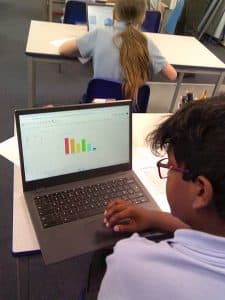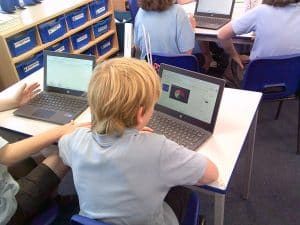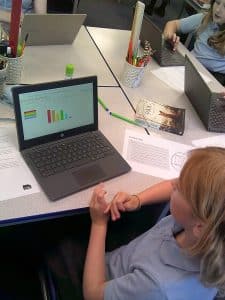
This week, we used our understanding of spreadsheets to collect information and turn it into clear, graphs in Google Sheets. We created bar charts, line graphs, and pie charts to represent different data. We added titles, labels, and carefully chosen colours to make the graphs easy to read. The children showed fantastic confidence in using spreadsheets to present data clearly and accurately.